Over the past few decades, coastal communities have experienced an increase in the frequency and magnitude of local-area flooding. Government entities have recognized that future flooding zones and wave hazards must be included in resilience planning. After Superstorm Sandy, the Community Risk and Resiliency Act (CRRA) was established in New York to ensure that decisions regarding certain state permits and expenditures will consider climate risk, including sea level rise (SLR), and also require the Department of Environmental Conservation to adopt regulations establishing science-based state SLR projections.
We were contracted by the New York State Energy Research and Development Authority (NYSERDA) to update mapping data and create interactive website components that feature the future map layers of the coastal floodplain, including coverage, wave hazard zones, and SLR mapping for coastal communities across lower New York. With the new CRRA requirements, such information could be a valuable data resource for state administrators, scientists, and members of the community. We leveraged our expertise in climate change, coastal flooding, geospatial analysis, and web development to develop a solution to help meet their need.
Planning for Flooding
The interactive website tool we developed allows for municipalities to utilize scientific data for future planning, as well as residents and businesses to better prepare for future storms and flooding. The simulations depict how far inland future coastal flooding and strong waves could reach on Long Island and along the Hudson River, and it provides estimated projections of future SLR and storm surge on inundation and coastal flooding that could occur.

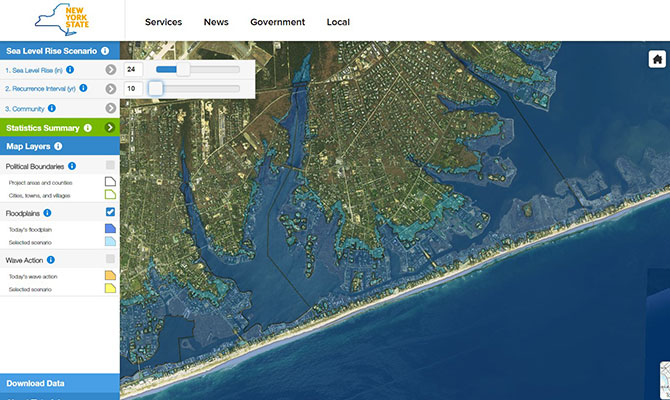
This visualization from the NYSERDA SLR mapping tool website shows 24-inches of SLR along the coast of New York with the light blue areas showing the potential increase in floodplain for a 10-year recurrence interval flood.
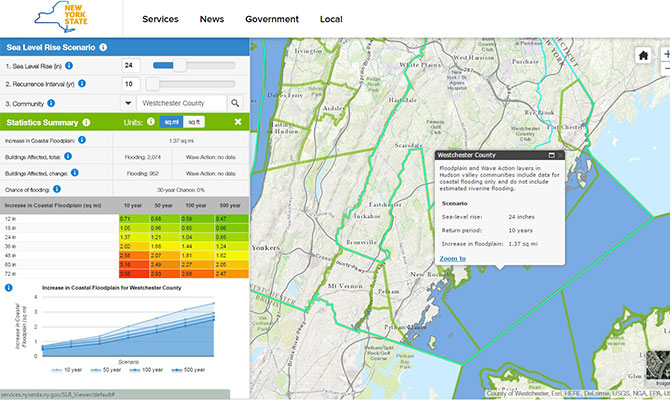
The website uses mapping tools that enable users to change the amount of SLR to see what coastal land areas and how many buildings will be impacted during different scales of future flood events. For example, the viewer tool shows that with a two-foot rise in sea level that Westchester County could have about a thousand additional structures subject to future flooding. Using the same scenario, Suffolk County, a community with much more extensive low-lying areas, could have an additional 15 thousand structures exposed to flooding.

This visualization summarizes changes in flood vulnerability for Westchester County, New York, for the 10-year recurrence interval with a scenario of 24 inches of SLR.
Utilizing Data from Different Flooding Frequencies
Normally, SLR mapping focuses on what will be flooded with tides and future 100-year flooding, but we include 10-year, 50-year, and 500-year recurrence interval floods to get a wider range of data for the potential flooding scenarios. We were able to analyze minor storms and coastal flooding events that are frequently occurring in New York and causing certain areas to experience repetitive flooding. Such areas of higher-frequency flooding, as represented by the 10-year recurrence interval floodplain, are expected to increase on average 1.5 times more than the regulatory floodplain. The relative potential of growth of the higher frequency flooding areas exemplifies why we may want to focus on the smaller, more frequent occurrences. Community planning that addresses vulnerability within these more frequently flooded areas has a high return on investment when it comes to mitigating future losses.